- About Us
-
 Secure, unlimited storage to ensures efficiency as well as high and continuous data access demand.
 Virtual server integration for 3D Rendering, AI or ML
 Enhance application capacity and availability.
 Access to an all-inclusive stack for AI development, driven by NVIDIA’s powerful technology!
 FPT Web Application Firewall provides powerful protection for web applications
 Advanced virtual server with rapid scalability
 Backup and restore data instantly, securely and maintain data integrity.
Advanced virtual server with rapid scalability
Access to an all-inclusive stack for AI development, driven by NVIDIA’s powerful technology!
Enhance application capacity and availability.
Backup and restore data instantly, securely and maintain data integrity.
Recovery, ensuring quick operation for the business after all incidents and disasters.
Backup and restore data instantly, securely and maintain data integrity.
Advanced virtual server with rapid scalability
Access to an all-inclusive stack for AI development, driven by NVIDIA’s powerful technology!
Enhance application capacity and availability.
Backup and restore data instantly, securely and maintain data integrity.
Recovery, ensuring quick operation for the business after all incidents and disasters.
 Diverse throughput and capacity to meet various business workloads.
Secure, unlimited storage to ensures efficiency as well as high and continuous data access demand.
FPT Web Application Firewall provides powerful protection for web applications
Intelligent and Comprehensive Virtual Web Application Firewall - Security Collaboration between FPT Cloud and Penta Security.
The Next generation firewall security service
Easily store, manage, deploy, and secure Container images
Safe, secure, stable, high-performance Kubernetes platform
Provided as a service to deploy, monitor, backup, restore, and scale MongoDB databases on cloud.
Provided as a service to deploy, monitor, backup, restore, and scale Redis databases on cloud.
Provided as a service to deploy, monitor, backup, restore, and scale PostgreSQL databases on cloud. System Monitoring Solution anywhere, anytime, anyplatform
 Helps reduce operational costs by up to 40% compared to traditional BI solutions, while improving efficiency through optimized resource usage and infrastructure scaling.
 - Pricing
- Partner
- Event


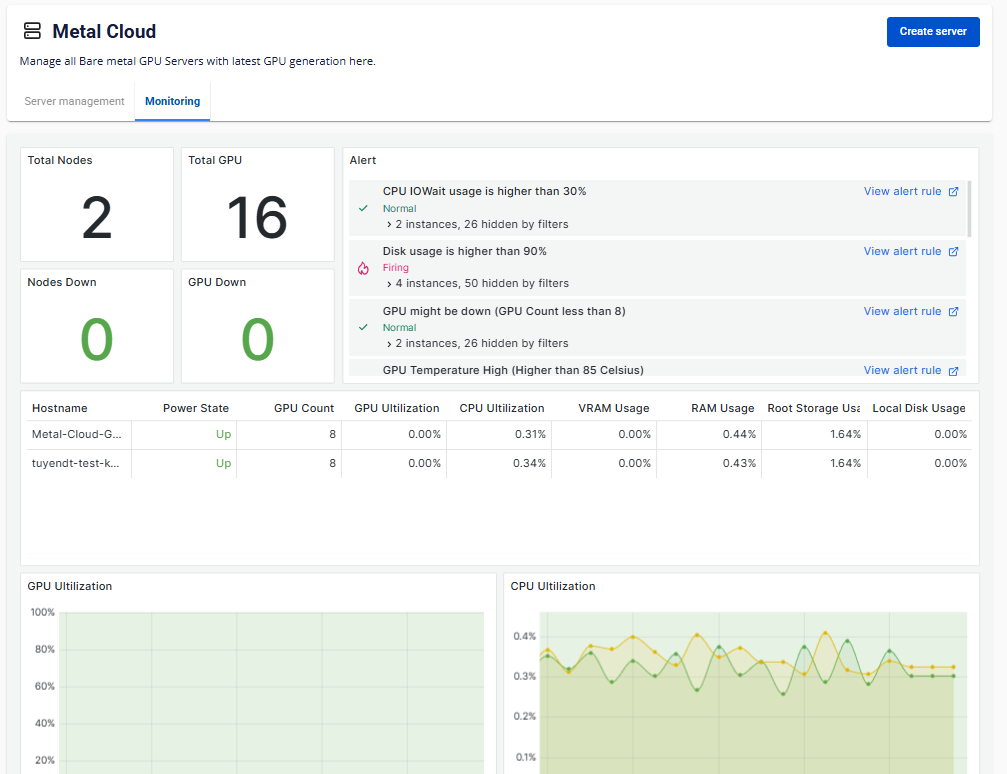
Monitor a Cluster and a Server
Monitor a Cluster and a Server
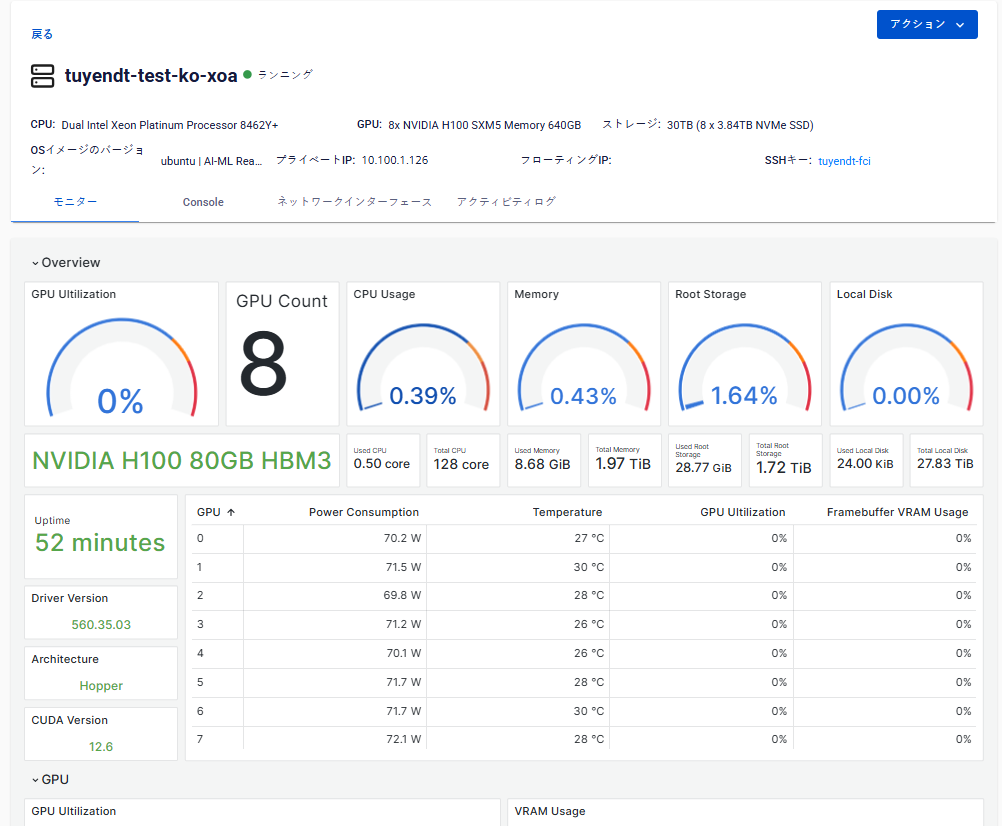
The monitoring feature is bundled with the AI Infrastructure—Metal Cloud service. The collection and visualization of metrics, logs, and events can help to identify potential issues and optimize future workloads. You may select an observability solution that best fits their needs.
| Metrics | A Cluster (in the same VPC) | A single Server |
|---|---|---|
| Total number of nodes and down nodes | ✔ | |
| GPU model, Driver & CUDA version | ✔ | |
| Power state | ✔ | |
| Uptime | ✔ | |
| Total number of GPUs and down GPUs | ✔ | ✔ |
| GPU Utilization | ✔ | ✔ |
| GPU Memory | ✔ | ✔ |
| CPU Utilization | ✔ | ✔ |
| System Memory | ✔ | ✔ |
| Root Storage Usage | ✔ | ✔ |
| Local Disk Usage | ✔ | ✔ |
| Details of each GPUs Power consumption, Temperature, GPU Utilization, VRAM usage |
✔ | |
| Network Bandwidth Inbound/Outbound | ✔ | ✔ |
| Network Packets Sent/Received | ✔ | ✔ |
| Network Error rate Receive/Transmit | ✔ | |
| System Fan Speed | ✔ | |
| System Voltage | ✔ | |
| Common Alerts | ✔ |
1. A cluster within a VPC
2. A Server
© 2025 FPT Cloud. All Rights Reserved.