- About Us
-
 Secure, unlimited storage to ensures efficiency as well as high and continuous data access demand.
 Virtual server integration for 3D Rendering, AI or ML
 Enhance application capacity and availability.
 Access to an all-inclusive stack for AI development, driven by NVIDIA’s powerful technology!
 FPT Web Application Firewall provides powerful protection for web applications
 Advanced virtual server with rapid scalability
 Backup and restore data instantly, securely and maintain data integrity.
Advanced virtual server with rapid scalability
Access to an all-inclusive stack for AI development, driven by NVIDIA’s powerful technology!
Enhance application capacity and availability.
Backup and restore data instantly, securely and maintain data integrity.
Recovery, ensuring quick operation for the business after all incidents and disasters.
Backup and restore data instantly, securely and maintain data integrity.
Advanced virtual server with rapid scalability
Access to an all-inclusive stack for AI development, driven by NVIDIA’s powerful technology!
Enhance application capacity and availability.
Backup and restore data instantly, securely and maintain data integrity.
Recovery, ensuring quick operation for the business after all incidents and disasters.
 Diverse throughput and capacity to meet various business workloads.
Secure, unlimited storage to ensures efficiency as well as high and continuous data access demand.
FPT Web Application Firewall provides powerful protection for web applications
Intelligent and Comprehensive Virtual Web Application Firewall - Security Collaboration between FPT Cloud and Penta Security.
The Next generation firewall security service
Easily store, manage, deploy, and secure Container images
Safe, secure, stable, high-performance Kubernetes platform
Provided as a service to deploy, monitor, backup, restore, and scale MongoDB databases on cloud.
Provided as a service to deploy, monitor, backup, restore, and scale Redis databases on cloud.
Provided as a service to deploy, monitor, backup, restore, and scale PostgreSQL databases on cloud. System Monitoring Solution anywhere, anytime, anyplatform
 Helps reduce operational costs by up to 40% compared to traditional BI solutions, while improving efficiency through optimized resource usage and infrastructure scaling.
 - Pricing
- Partner
- Event


Incident Data Visualization
Incident Data Visualization
Incident Insights enables the ability to visualize incident data, facilitating the exploration of metrics and trends in incident response performance
View Incident Insights
Step 1: Log in to FMON Grafana.
Step 2: From the sidebar menu, choose Apps > FMON - Incident > Insights
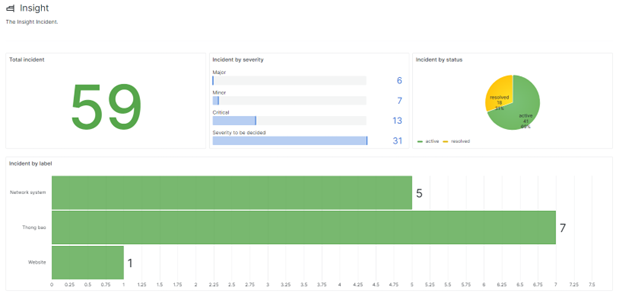
The incident data visualization chart displays the following key metrics:
-
Total Incident: Total number of incidents
-
Incident by severity: Number of incidents by importance level
-
Incident by status: Number of incidents by incident status
-
Incident by label: Number of incidents by labels attached to incidents
© 2025 FPT Cloud. All Rights Reserved.