GPU Container provides container logs and metrics to help you monitor and troubleshoot your workloads. To view your logs and metrics, open the Details Container screen, open the Logs or Monitoring tab. This gives you container logs and metrics monitoring, making it easy to diagnose issues or monitor your container’s activity.
Container Logs
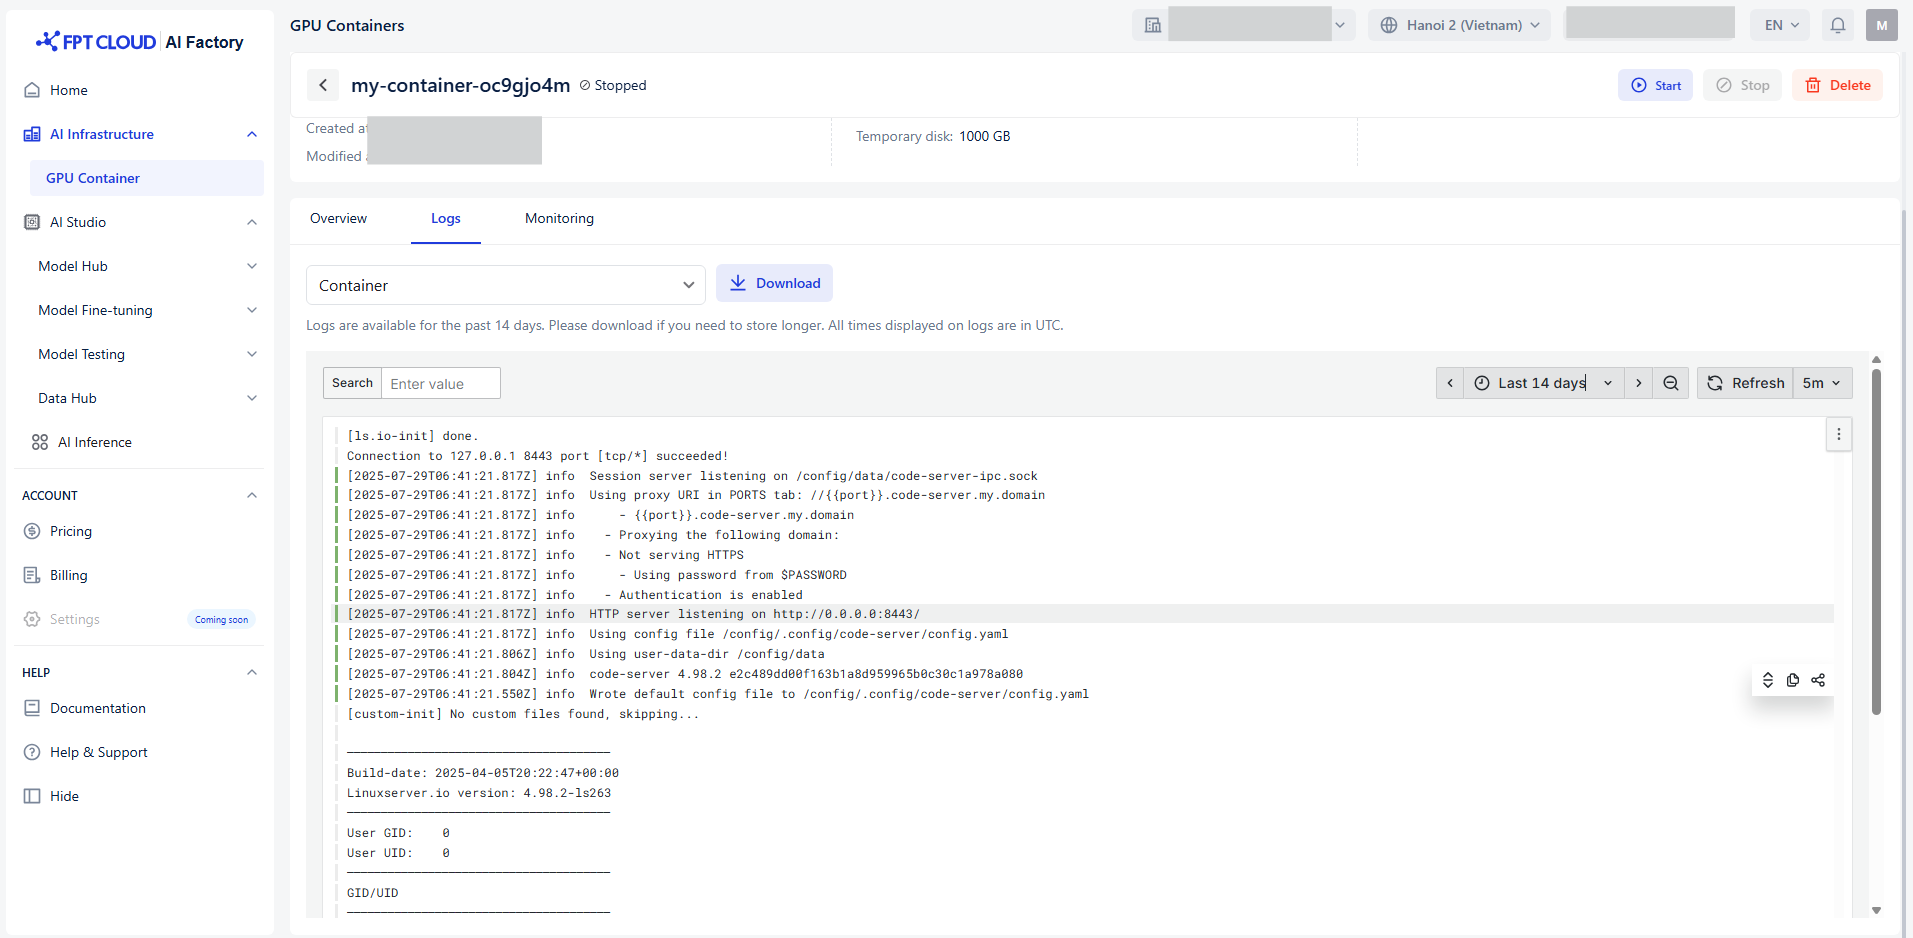
Container logs include all application logs. Note that logs are only kept for 14 days, and timestamps are shown in the UTC time zone. .
-
Download: Download logs from the last 14 days of your container.
-
Search: Enter a keyword to search within the log content.
-
Time Filter: Filter logs by specific time ranges.
-
Refresh: Interval at which the container logs are automatically updated.
Metric Monitoring
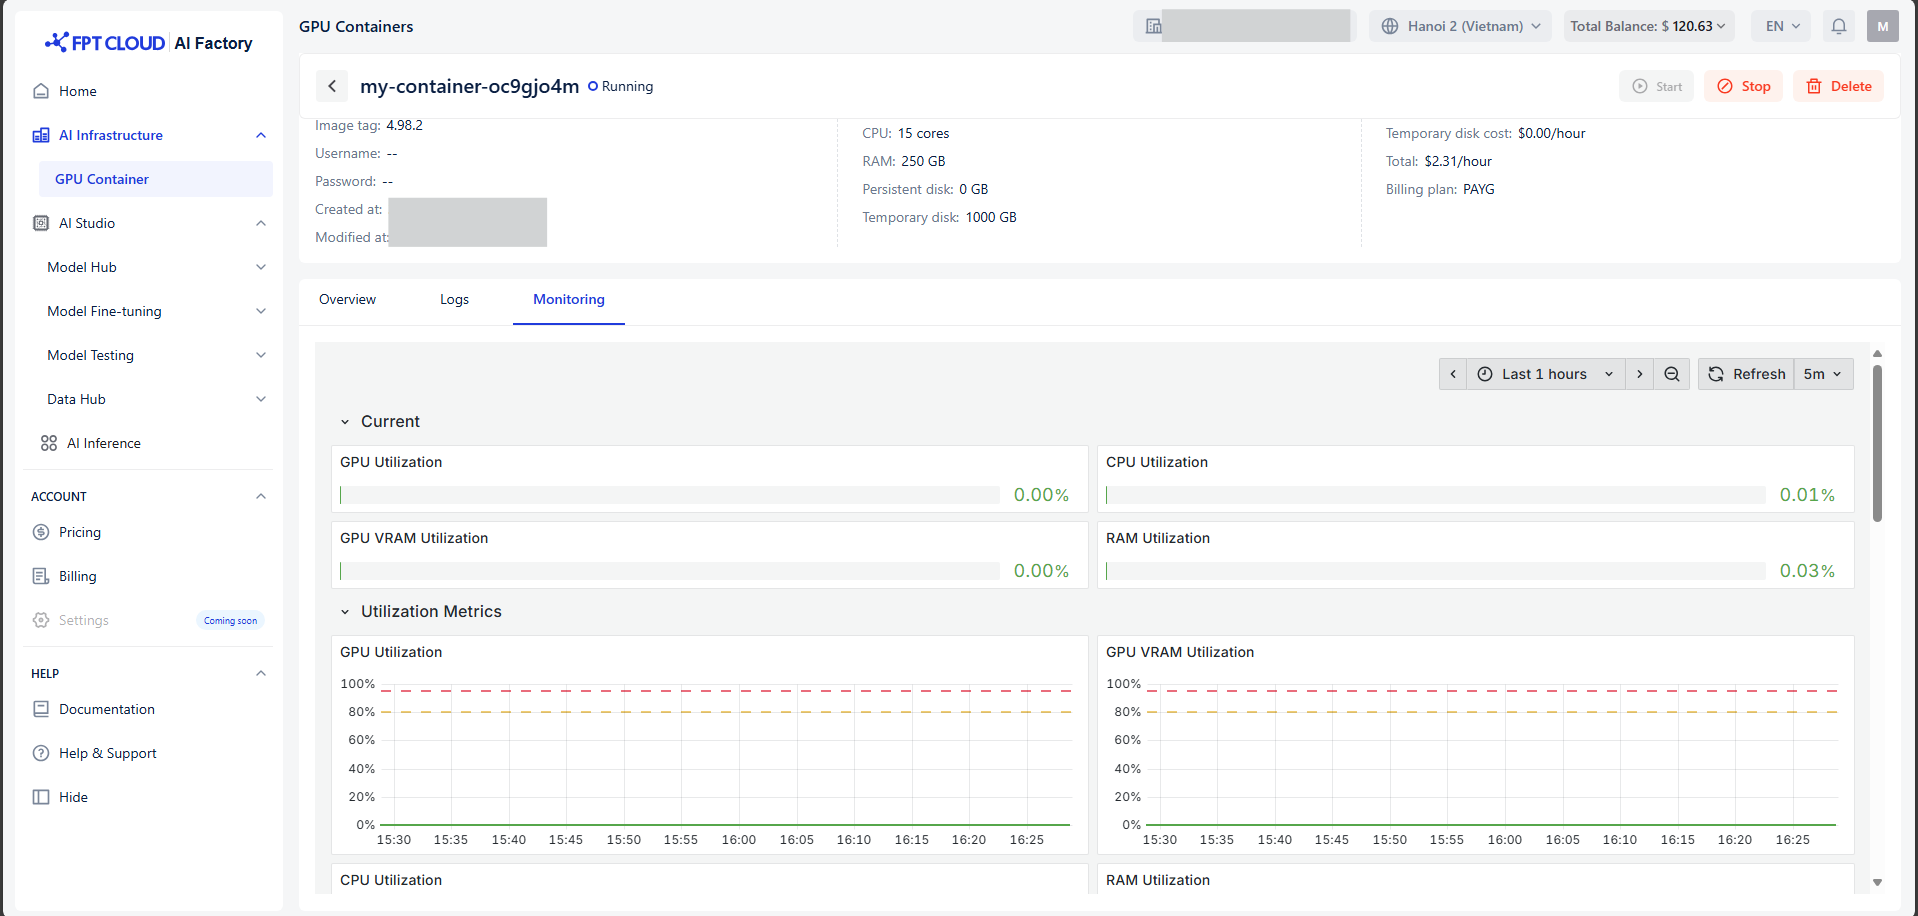
Monitoring metrics are collected to track the performance, availability, and resource usage of containerized services, helping detect issues and optimize operations. Note that metric data is retained for 14 days.
There are 4 metric groups:
-
Utilization metrics: Monitor CPU, memory, and GPU usage to assess system performance and resource efficiency.
-
Disk metrics: Track disk read/write speed, and latency to detect storage issues or bottlenecks.
-
Network metric: Measure network traffic, latency, and errors to identify connectivity problems and ensure service reliability.
-
Temperature and Power metrics: Monitor hardware temperature and power consumption to prevent overheating and maintain hardware health
-
Time Filter: Filter metrics by specific time ranges.
-
Refresh: Interval at which the container metrics are automatically updated.
