- About Us
-
 Secure, unlimited storage to ensures efficiency as well as high and continuous data access demand.
 Virtual server integration for 3D Rendering, AI or ML
 Enhance application capacity and availability.
 Access to an all-inclusive stack for AI development, driven by NVIDIA’s powerful technology!
 FPT Web Application Firewall provides powerful protection for web applications
 Advanced virtual server with rapid scalability
 Backup and restore data instantly, securely and maintain data integrity.
Advanced virtual server with rapid scalability
Access to an all-inclusive stack for AI development, driven by NVIDIA’s powerful technology!
Enhance application capacity and availability.
Backup and restore data instantly, securely and maintain data integrity.
Recovery, ensuring quick operation for the business after all incidents and disasters.
Backup and restore data instantly, securely and maintain data integrity.
Advanced virtual server with rapid scalability
Access to an all-inclusive stack for AI development, driven by NVIDIA’s powerful technology!
Enhance application capacity and availability.
Backup and restore data instantly, securely and maintain data integrity.
Recovery, ensuring quick operation for the business after all incidents and disasters.
 Diverse throughput and capacity to meet various business workloads.
Secure, unlimited storage to ensures efficiency as well as high and continuous data access demand.
FPT Web Application Firewall provides powerful protection for web applications
Intelligent and Comprehensive Virtual Web Application Firewall - Security Collaboration between FPT Cloud and Penta Security.
The Next generation firewall security service
Easily store, manage, deploy, and secure Container images
Safe, secure, stable, high-performance Kubernetes platform
Provided as a service to deploy, monitor, backup, restore, and scale MongoDB databases on cloud.
Provided as a service to deploy, monitor, backup, restore, and scale Redis databases on cloud.
Provided as a service to deploy, monitor, backup, restore, and scale PostgreSQL databases on cloud. System Monitoring Solution anywhere, anytime, anyplatform
 Helps reduce operational costs by up to 40% compared to traditional BI solutions, while improving efficiency through optimized resource usage and infrastructure scaling.
 - Pricing
- Partner
- Event


FPT Cloud utilizes NVIDIA GPU Telemetry with kube-prometheus-stack as a monitoring toolkit for Kubernetes cluster with GPU. The toolkit consists of collectors, a Time-series Database to store metrics, and a visualizer to visualize data. The toolkit uses widely-known open-sourced tools such as Prometheus and Grafana. Prometheus also includes Alertmanager to create and manage alerts. Prometheus is deployed alongside kube-state-metrics and node_exporter to collect cluster-level metrics such as Kubernetes API resources and node-level metrics such as GPU utilization.
- To view GPU’s custom metrics, run this command:
kubectl get –raw /apis/custom.metrics.k8s.io/v1beta1 | jq –r . | grep DCGM- Access Prometheus to view GPU DCGM’s metrics:
To forward Prometheus’ service, run this command:
kubectl port-forward service/kube-prometheus-stack-1679-prometheus 9090:63090Where 9090 is Prometheus’ service port, 63090 is local port on your client. Prometheus is now accessible locally at http://localhost:63090/
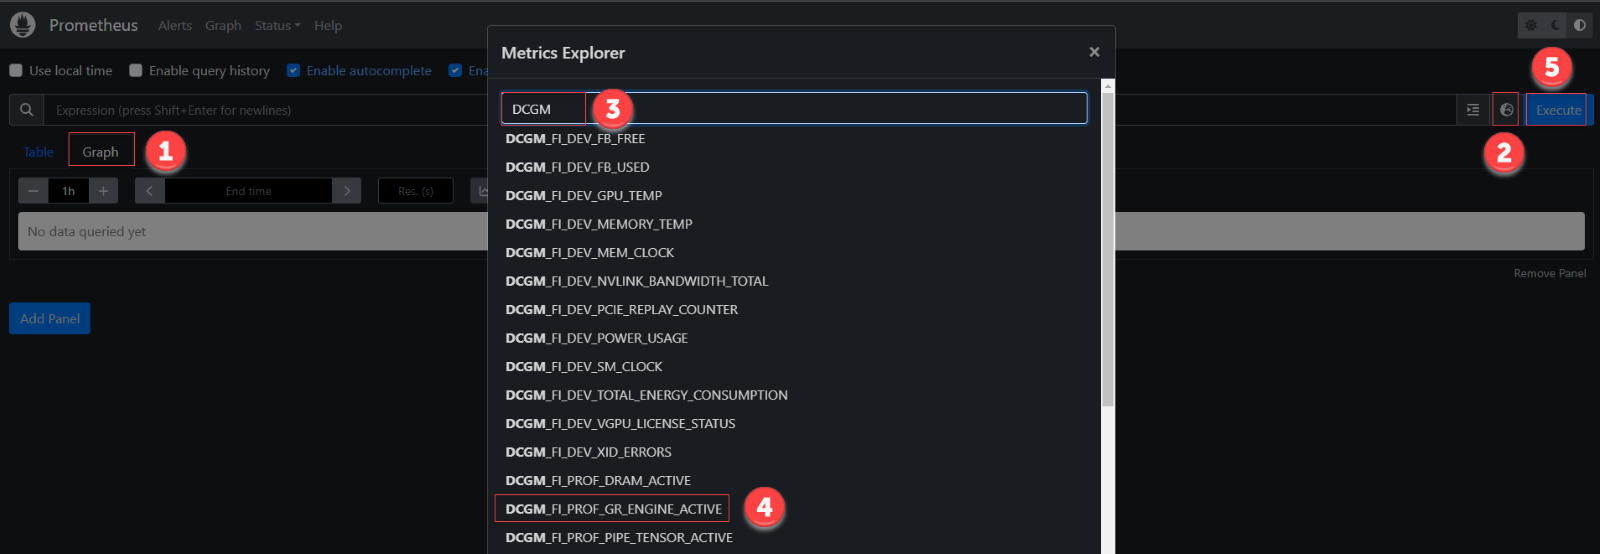
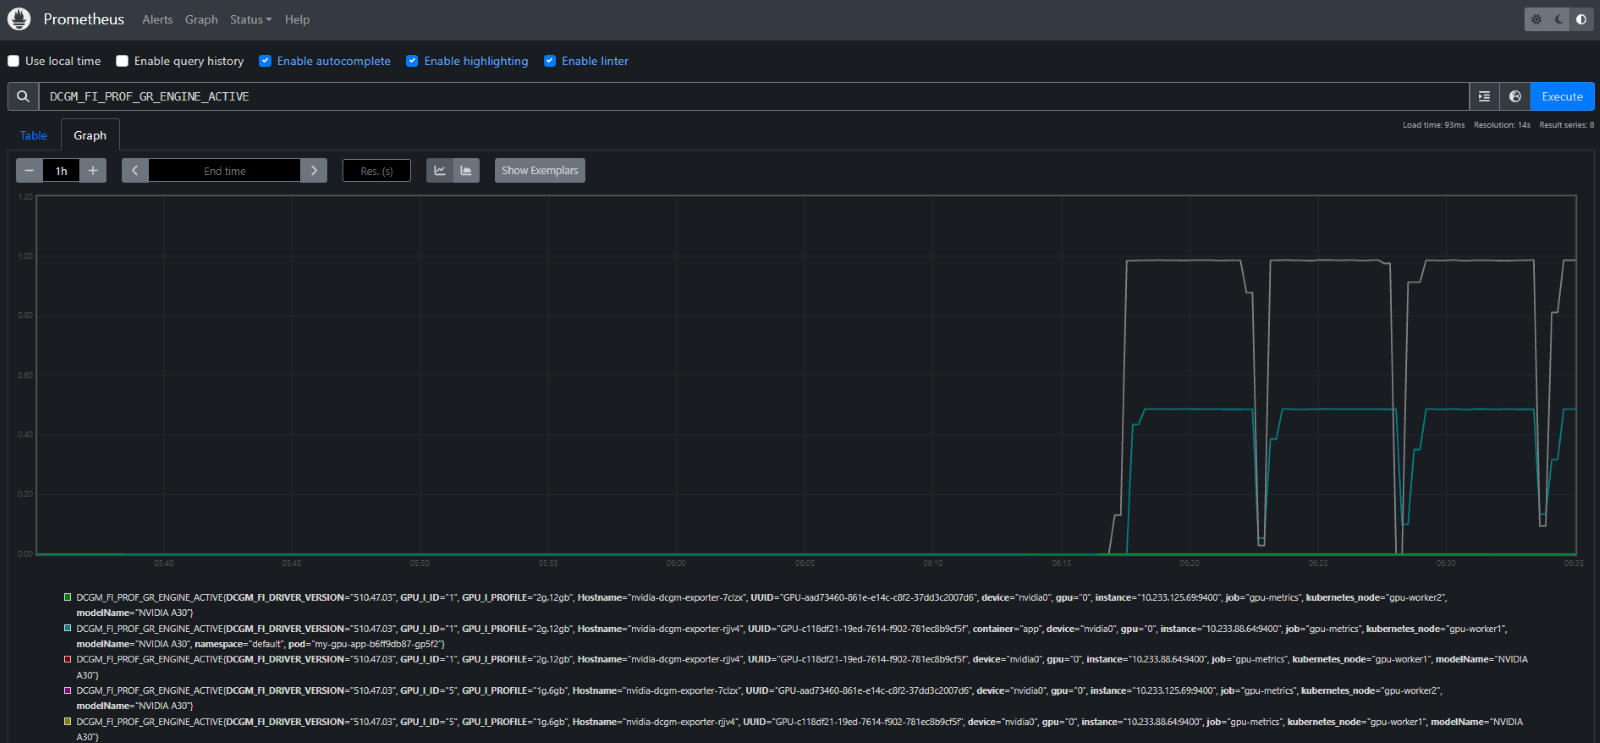
On the Prometheus interface, navigate to Metrics Explorer to view GPU DCGM’s metrics:
- Access Grafana Dashboard
To forward Grafana’s service, run this command:
kubectl port-forward service/kube-prometheus-stack-1679050354-grafana 80:63080Where 80 is Grafana’s service port, 63080 is local port on your client. Grafana is now accessible locally at http://localhost:63080/
The default username and password for logging into Grafana are:
User: admin
Password: prom-operator- Import Grafana Dashboard for GPU metrics:
To import the Dashboard, navigate to Grafana > Dashboards > Manage > Import.
To use FPT Cloud’s GPU Dashboard, copy this FPT Cloud GPU Dashboard json dashboard as text or import JSON file > Load.
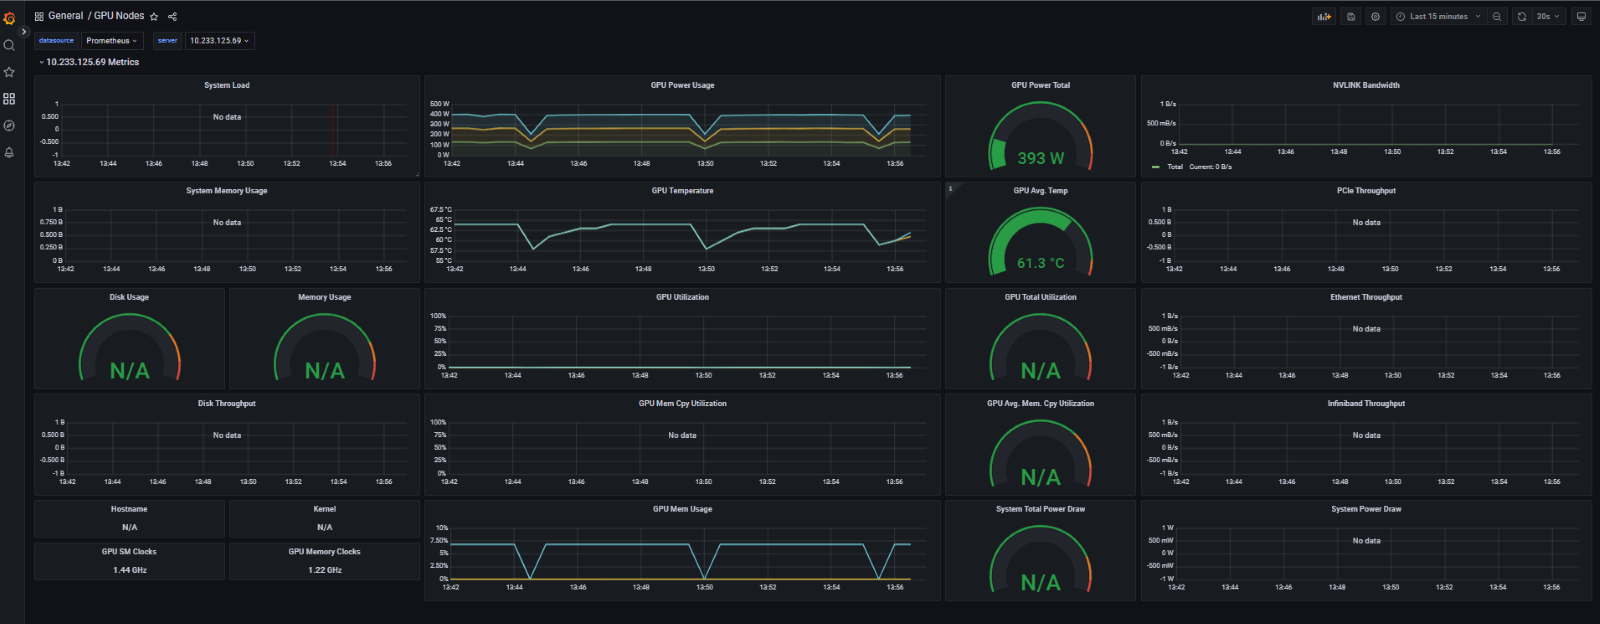
FPT Cloud’s GPU Dashboard: