- About Us
-
 Secure, unlimited storage to ensures efficiency as well as high and continuous data access demand.
 Virtual server integration for 3D Rendering, AI or ML
 Enhance application capacity and availability.
 Access to an all-inclusive stack for AI development, driven by NVIDIA’s powerful technology!
 FPT Web Application Firewall provides powerful protection for web applications
 Advanced virtual server with rapid scalability
 Backup and restore data instantly, securely and maintain data integrity.
Advanced virtual server with rapid scalability
Access to an all-inclusive stack for AI development, driven by NVIDIA’s powerful technology!
Enhance application capacity and availability.
Backup and restore data instantly, securely and maintain data integrity.
Recovery, ensuring quick operation for the business after all incidents and disasters.
Backup and restore data instantly, securely and maintain data integrity.
Advanced virtual server with rapid scalability
Access to an all-inclusive stack for AI development, driven by NVIDIA’s powerful technology!
Enhance application capacity and availability.
Backup and restore data instantly, securely and maintain data integrity.
Recovery, ensuring quick operation for the business after all incidents and disasters.
 Diverse throughput and capacity to meet various business workloads.
Secure, unlimited storage to ensures efficiency as well as high and continuous data access demand.
FPT Web Application Firewall provides powerful protection for web applications
Intelligent and Comprehensive Virtual Web Application Firewall - Security Collaboration between FPT Cloud and Penta Security.
The Next generation firewall security service
Easily store, manage, deploy, and secure Container images
Safe, secure, stable, high-performance Kubernetes platform
Provided as a service to deploy, monitor, backup, restore, and scale MongoDB databases on cloud.
Provided as a service to deploy, monitor, backup, restore, and scale Redis databases on cloud.
Provided as a service to deploy, monitor, backup, restore, and scale PostgreSQL databases on cloud. System Monitoring Solution anywhere, anytime, anyplatform
 Helps reduce operational costs by up to 40% compared to traditional BI solutions, while improving efficiency through optimized resource usage and infrastructure scaling.
 - Pricing
- Partner
- Event
Managed – FPT Database Engine
-
 Concepts
-
 Initial Setup
-
 Tutorials
-
 Peformance & Benchmark
-
 Troubleshooting
-
 FAQs
FAQs
-
 Glossary
-
The Monitoring feature provides real-time visibility into the operational health, performance, and resource utilization of database clusters on FPT Cloud. It collects and visualizes key metrics and logs, enabling you to:
- Detect anomalies early.
- Evaluate query workload.
- Take proactive actions to optimize availability and performance.
Monitoring in FPT Database Engine integrates with FPT Monitoring to collect database metrics and logs, and provides dashboards and alerts when required.
This guide describes how to access, configure, and use Monitoring to track the health and performance of database clusters in the FPT Cloud Portal.
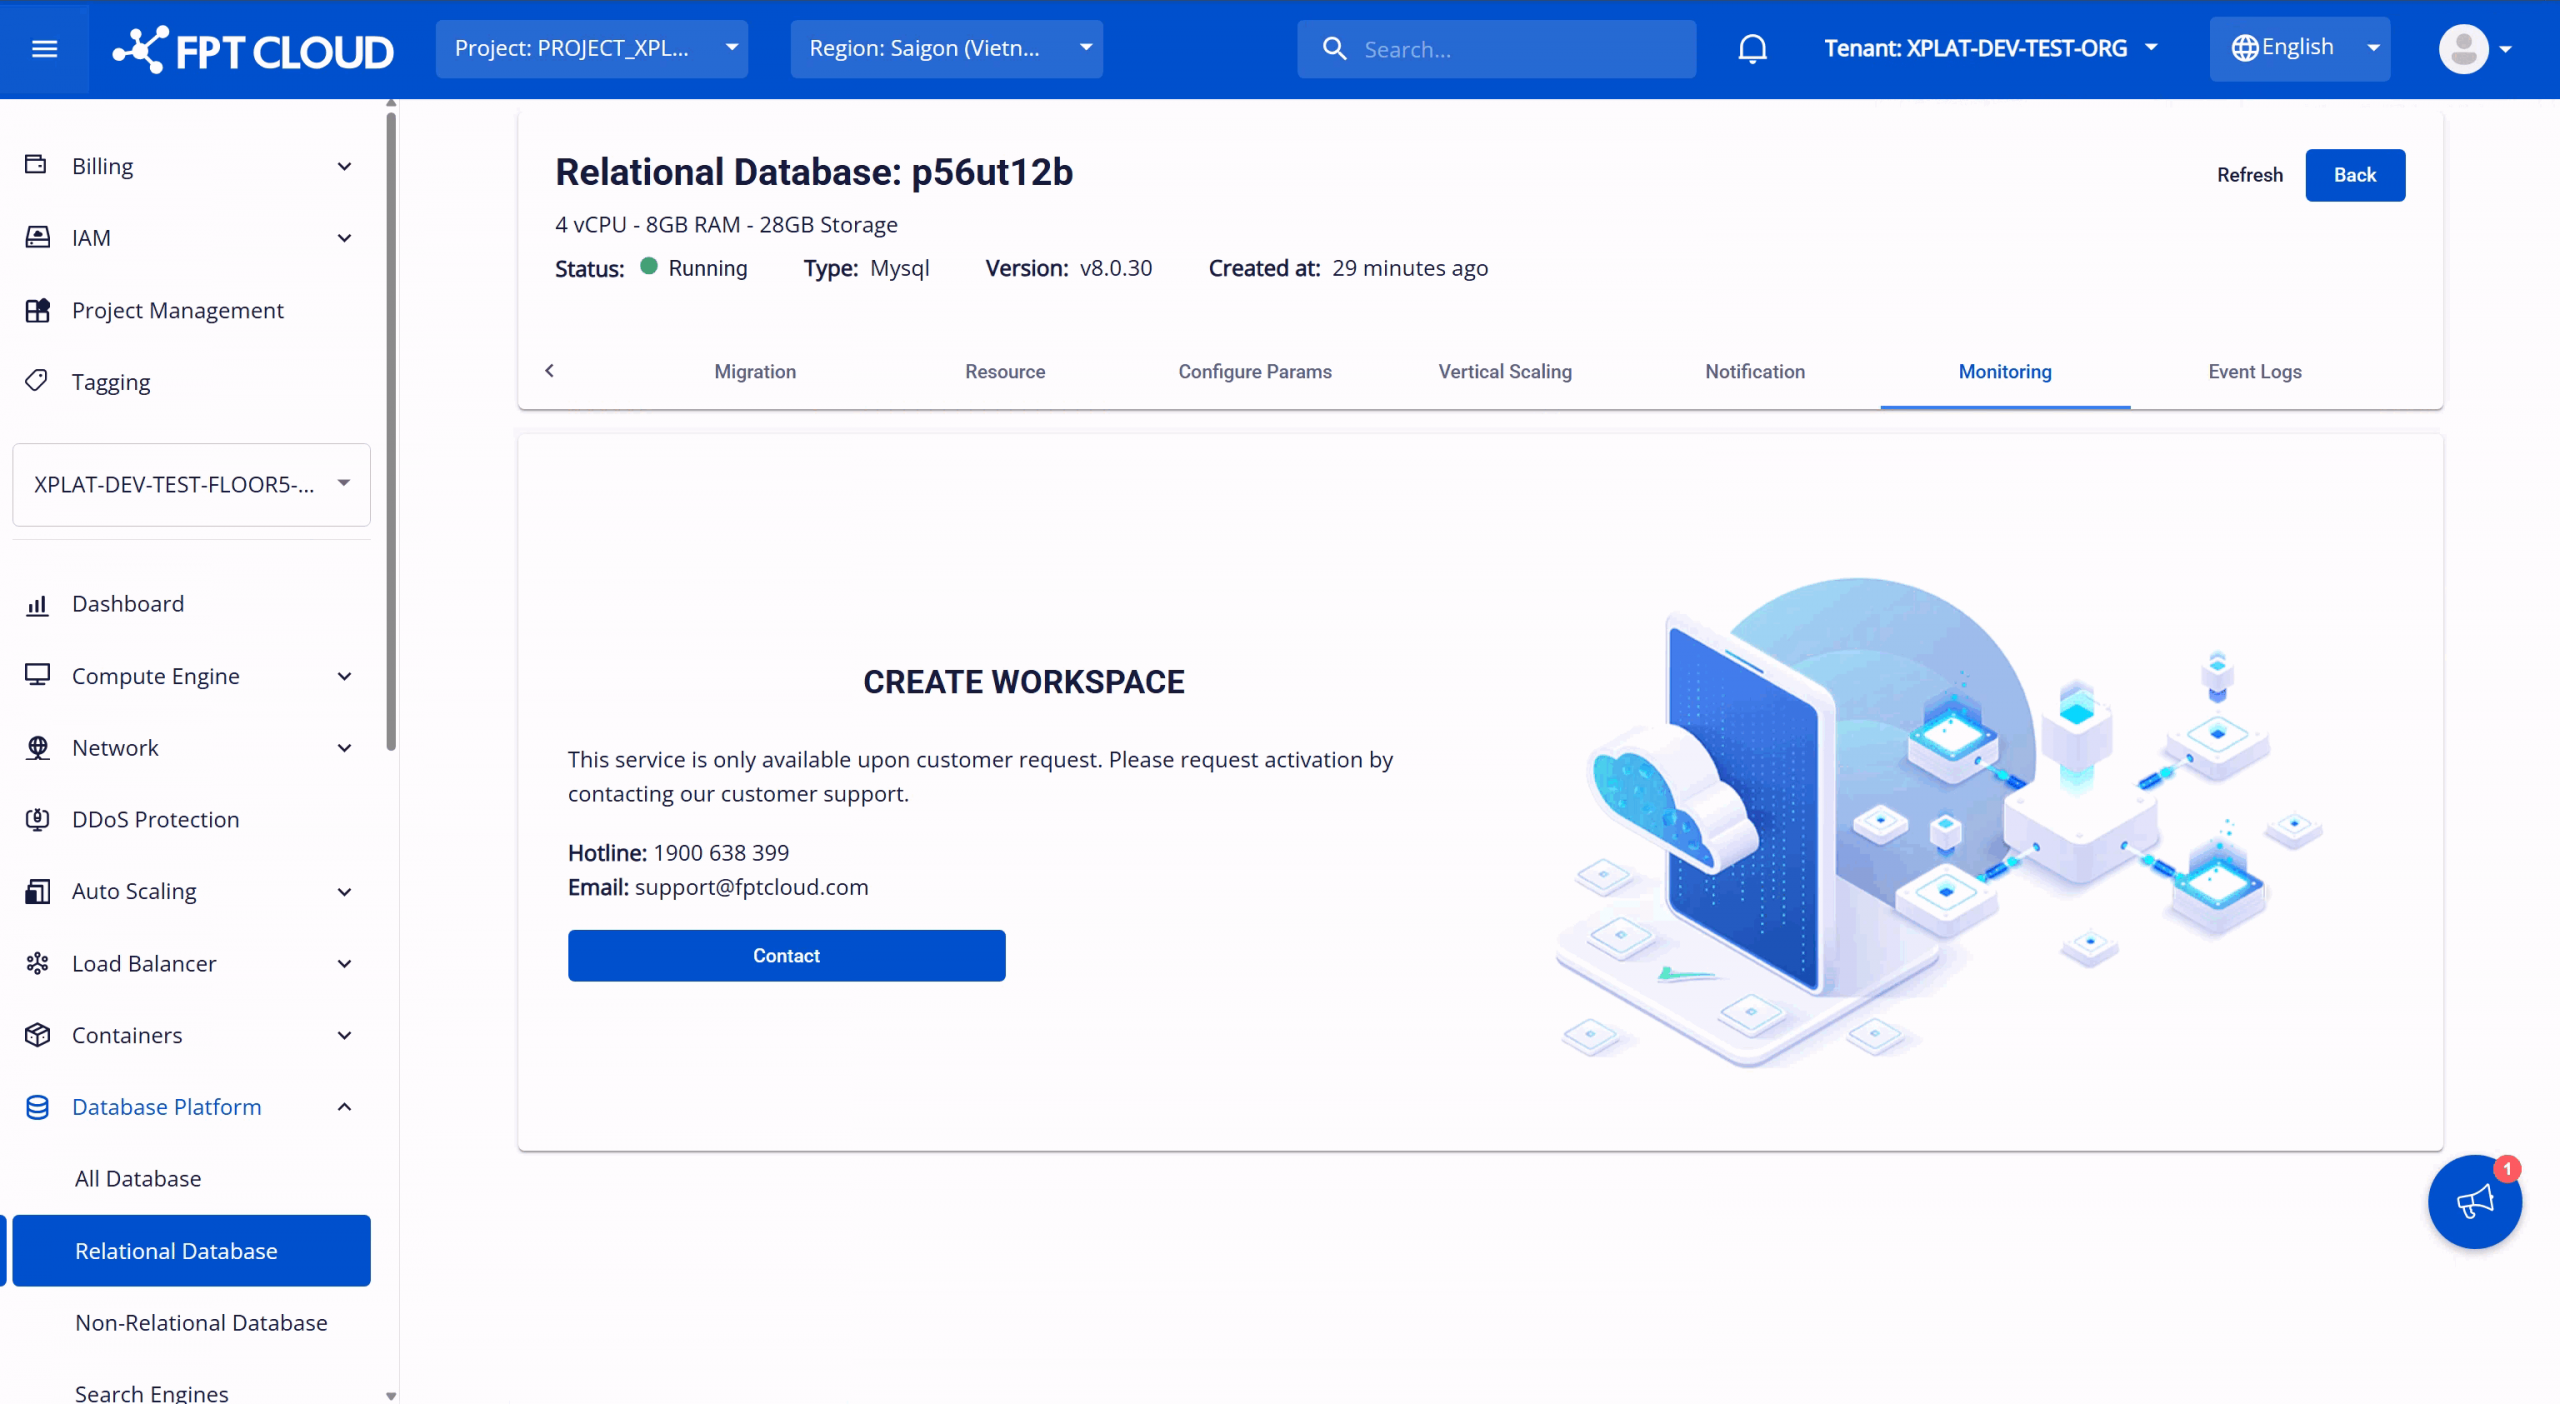
Step 1: Access Monitoring
Log in to FPT Cloud Portal. From the main menu, select Database Platform → All Databases. Click the ID of the target database cluster. Swich to the “Monitor” tab to access the feature. The screen behavior depends on the Monitoring activation status:
- Monitoring not enabled: The system displays a page prompting you to contact FPT Support. Contact the support team to enable Monitoring.
- Monitoring enabled: The system displays a list of database-specific metrics and logs. Metrics or logs that are not integrated with FPT Monitoring show Intergrated Status = “Disabled”.
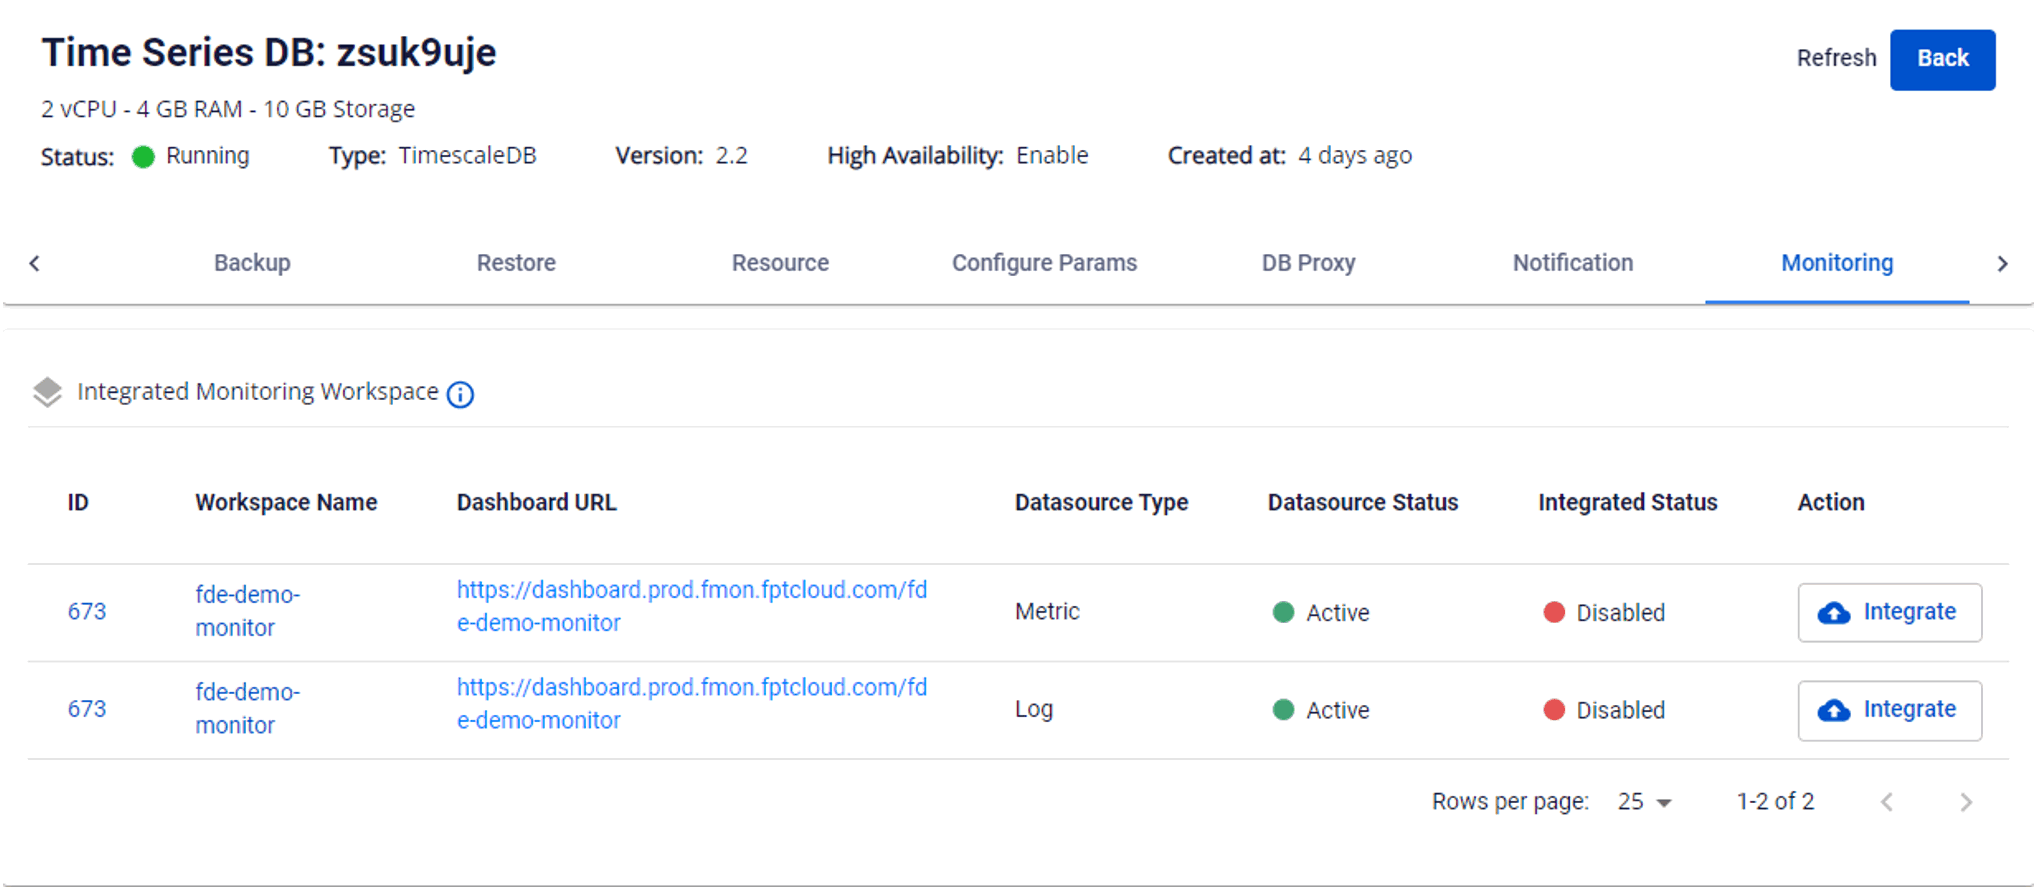
Step 2: Integrate/disintegrate monitoring
- Integrate monitoring: Disables metric/log collection for a database cluster. To integrate, on Workspace List, select “Integrate” for the target workspace. Confirm the action in the warning dialog to complete. After successful integration, Integrated Status changes to “Enabled”, FPT Monitoring starts collecting the corresponding metrics.
- Disintegrate monitoring: Disables metric/log collection for a database cluster. To disintegrate, on Workspace List, select “Disintegrate” for the target workspace. Confirm the action in the warning dialog to complete. After successful disintegration, Intergrated Status changes to “Disabled”, FPT Monitoring stops collecting the corresponding metrics.
Step 3: View workspace information
After monitoring integration is successful (Integrated Status = “Enabled”), select the workspace name to open the workspace details page. On this page, you can access information: Monitoring dashboards, Contact points và Datasources.
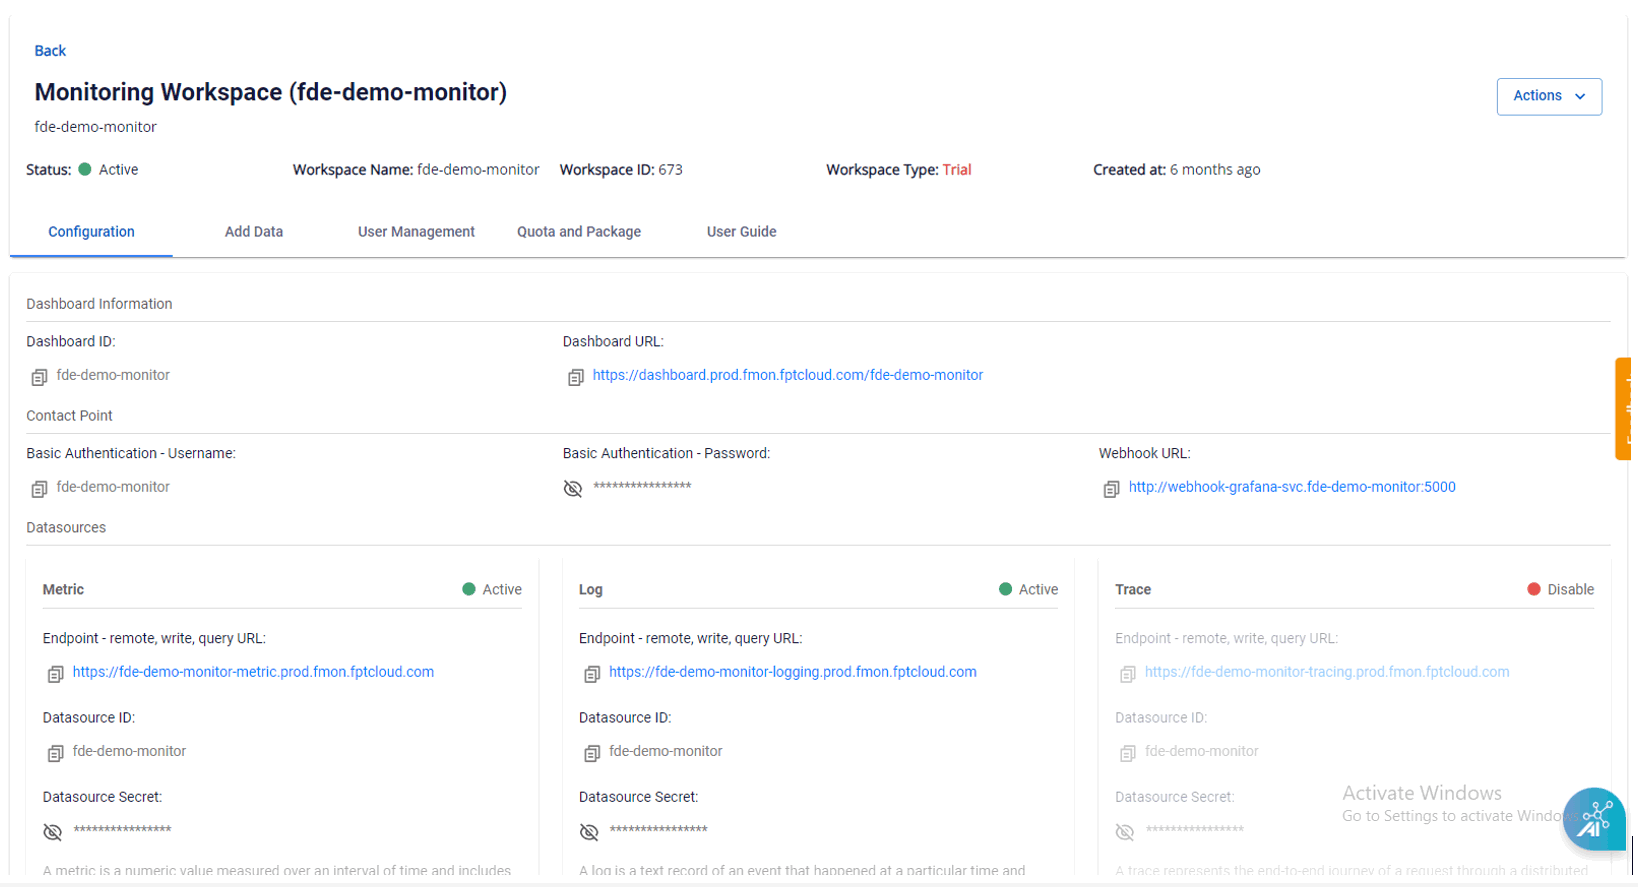
Step 4: View monitoring information
You can view dashboards that display real-time and historical metrics on Grafana by selecting the Dashboard URL, which redirects you to the sign-in page.
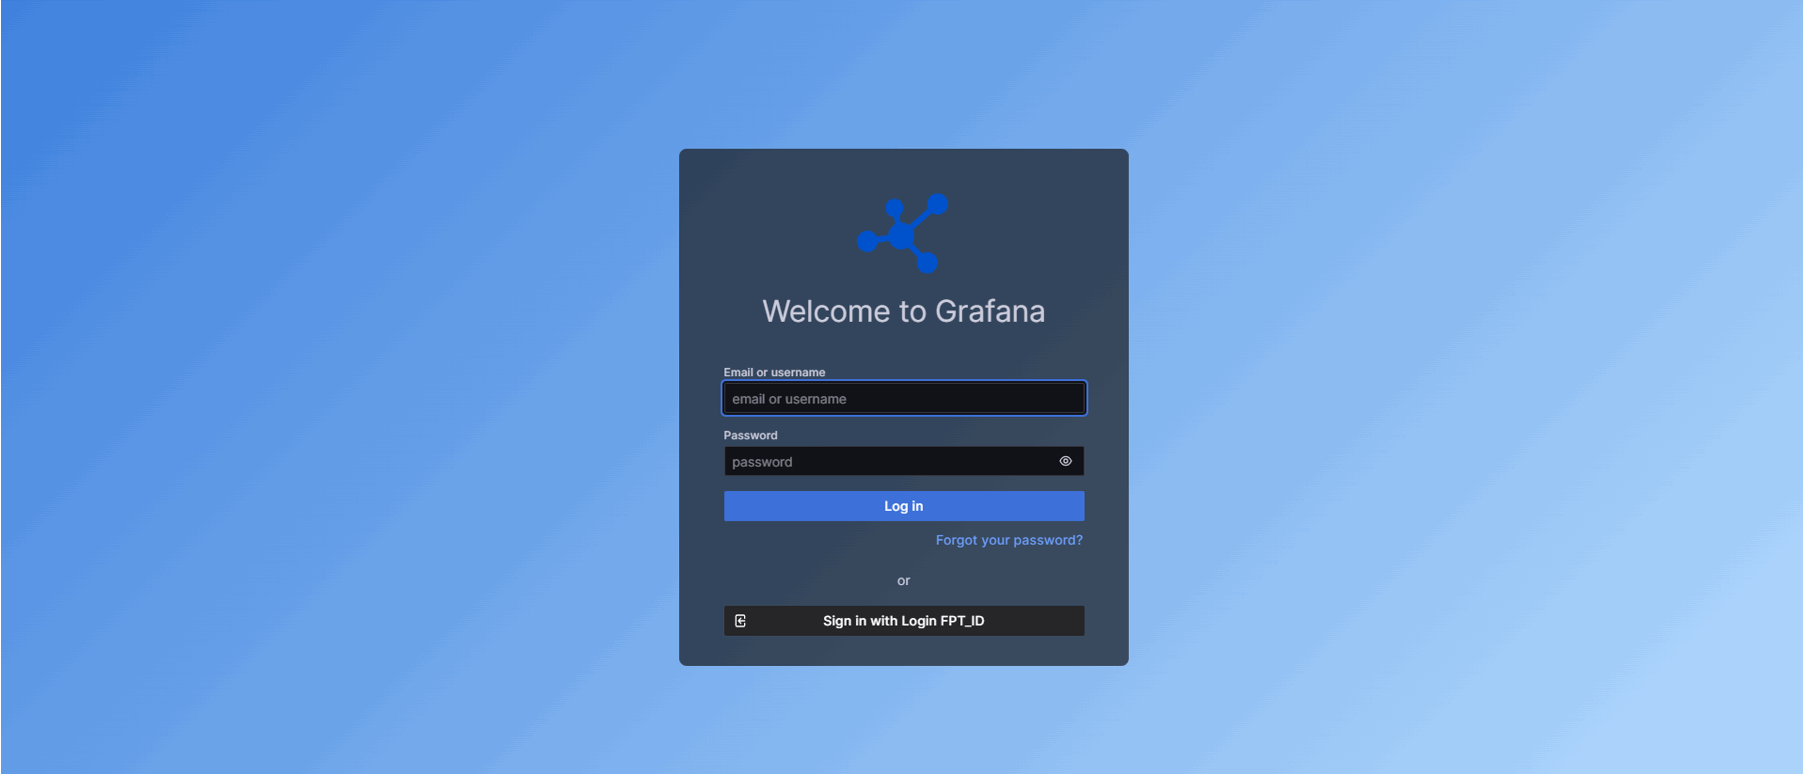
Enter the Basic Authentication – Username and Basic Authentication – Password provided on the workspace details page and click Login to access the Grafana homepage.
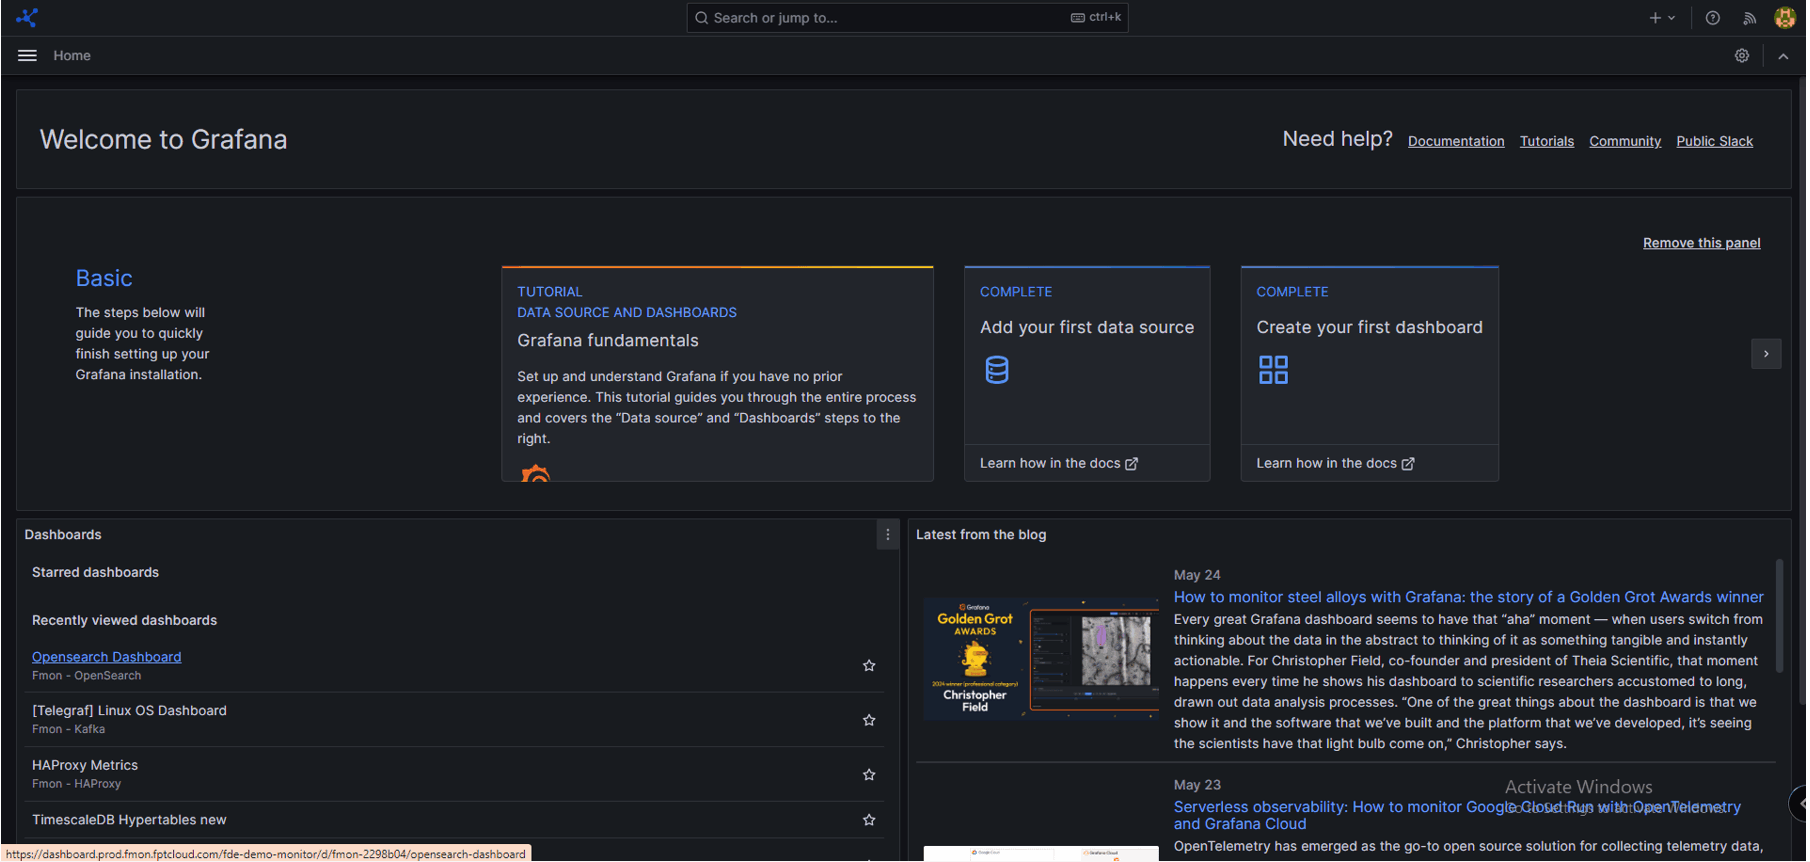
View metrics:
Click “Toggle Menu” > select “Dashboards”. The Dashboards page is displayed. Select the template that matches the database engine type to view available.
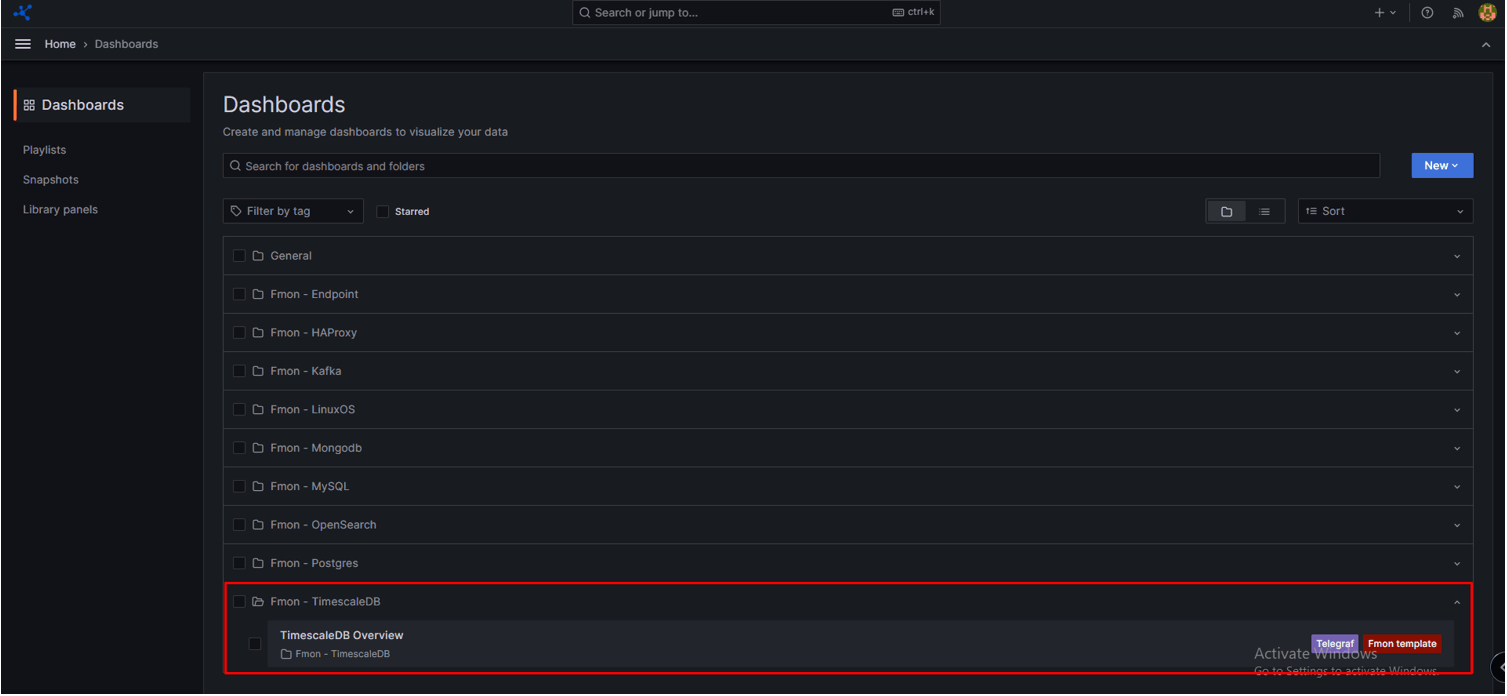
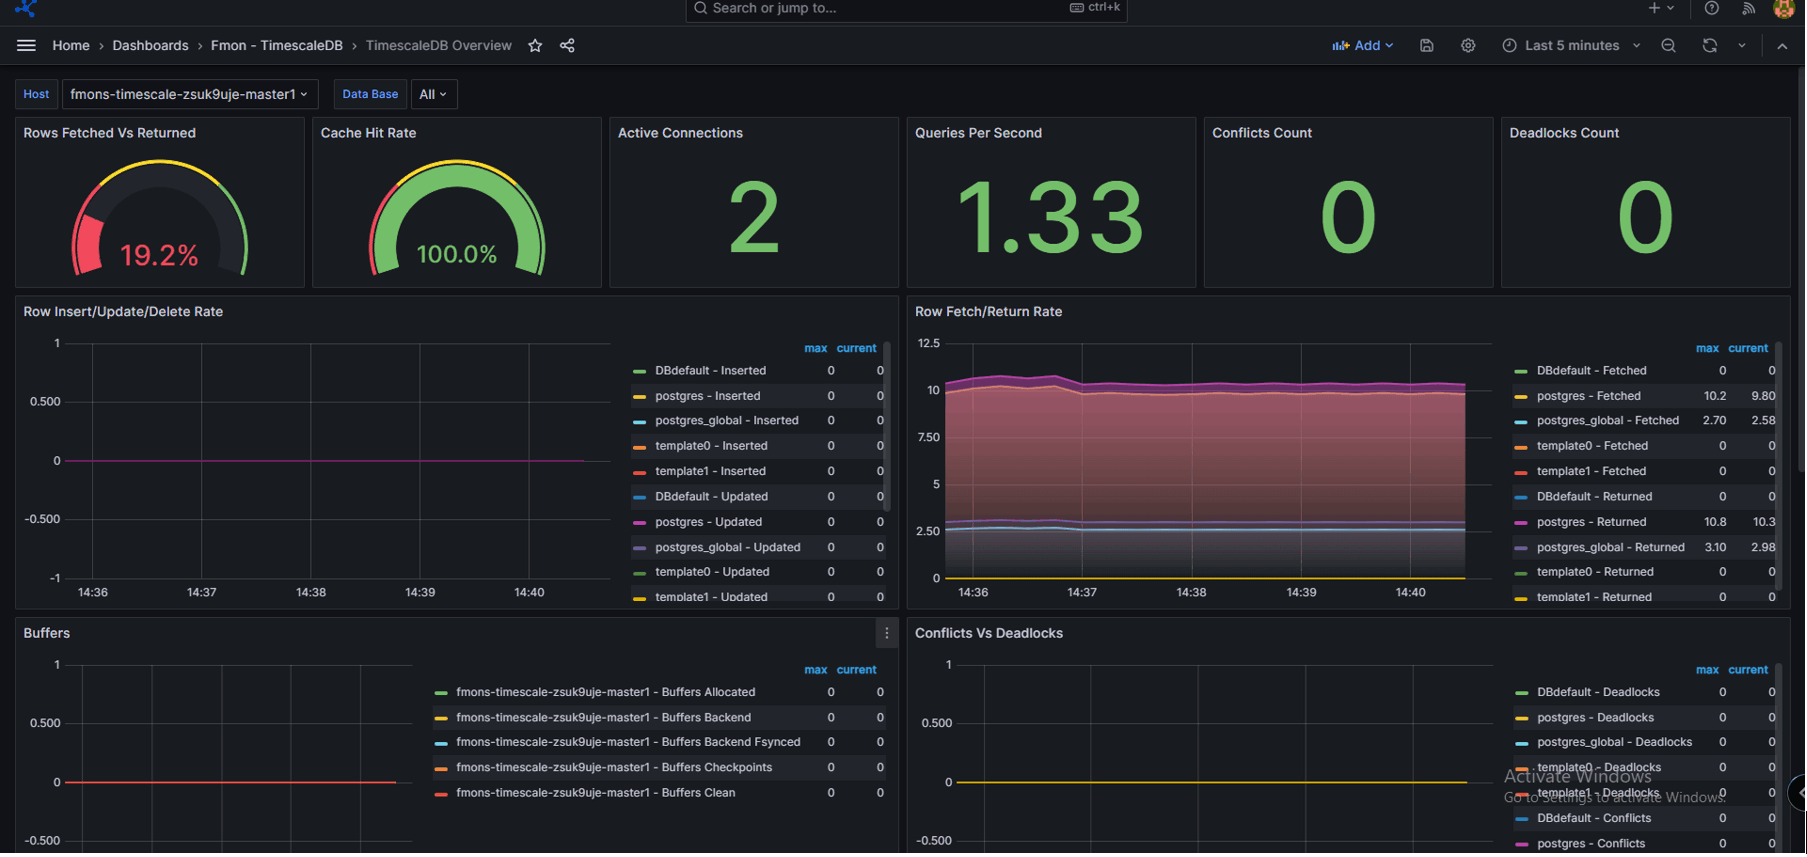
Select a folder to view the corresponding metric:
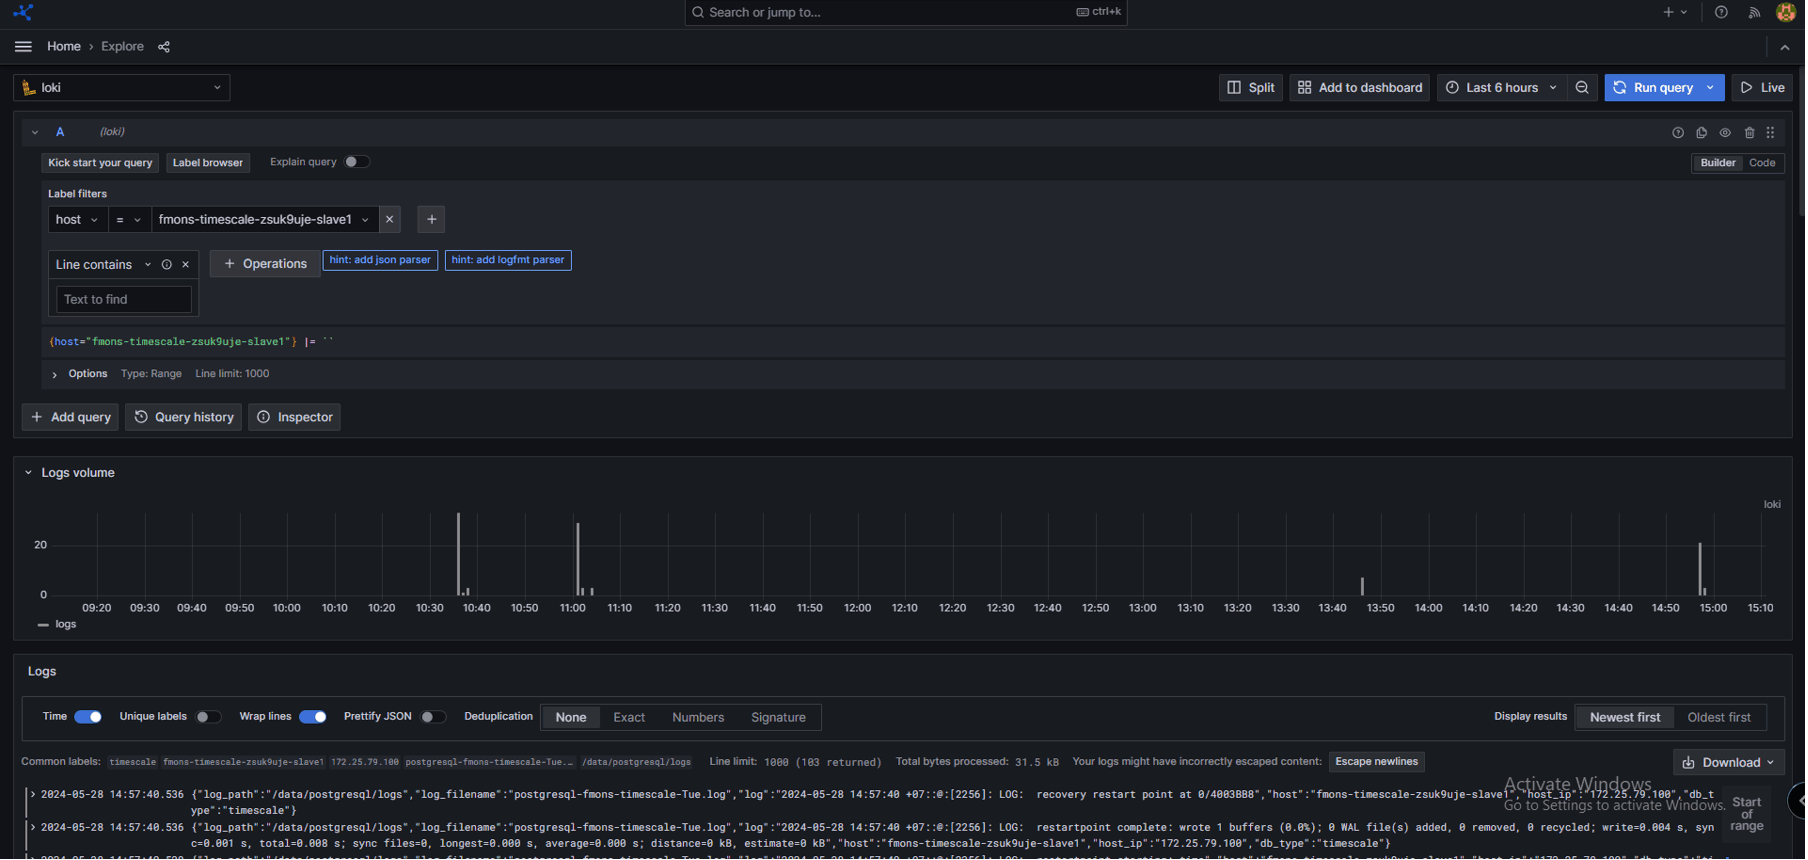
View Logs:
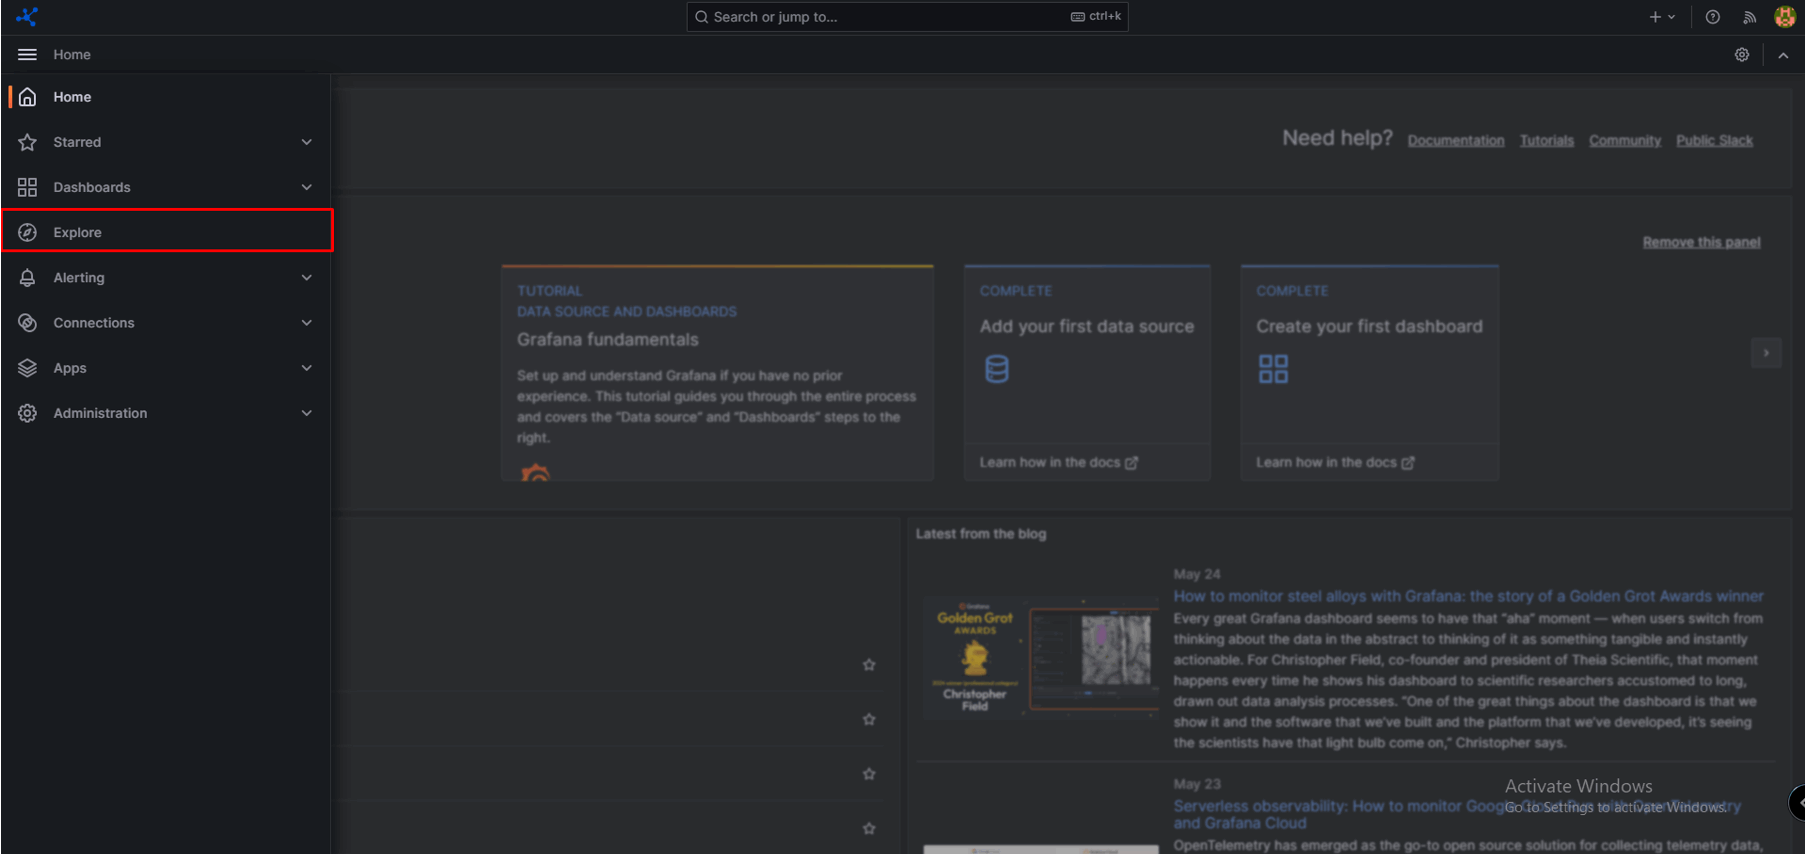
Click “Toggle Menu” > choose “Explore”:
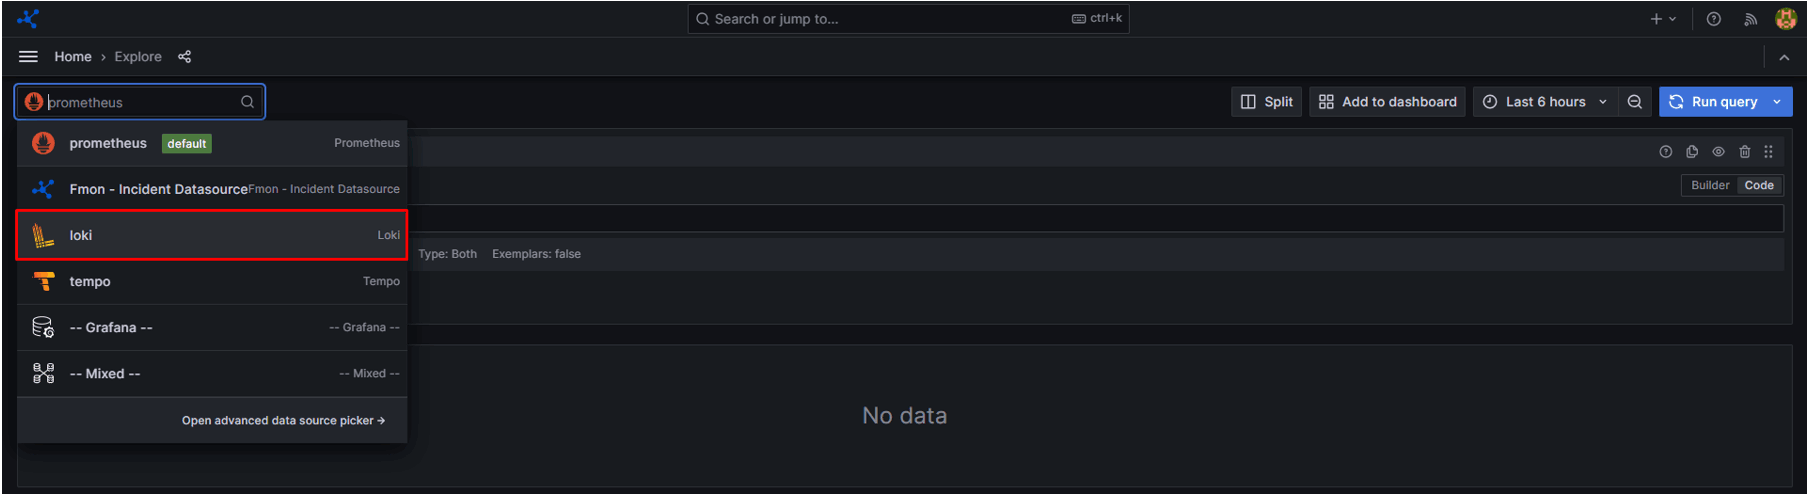
Choose “Loki”:
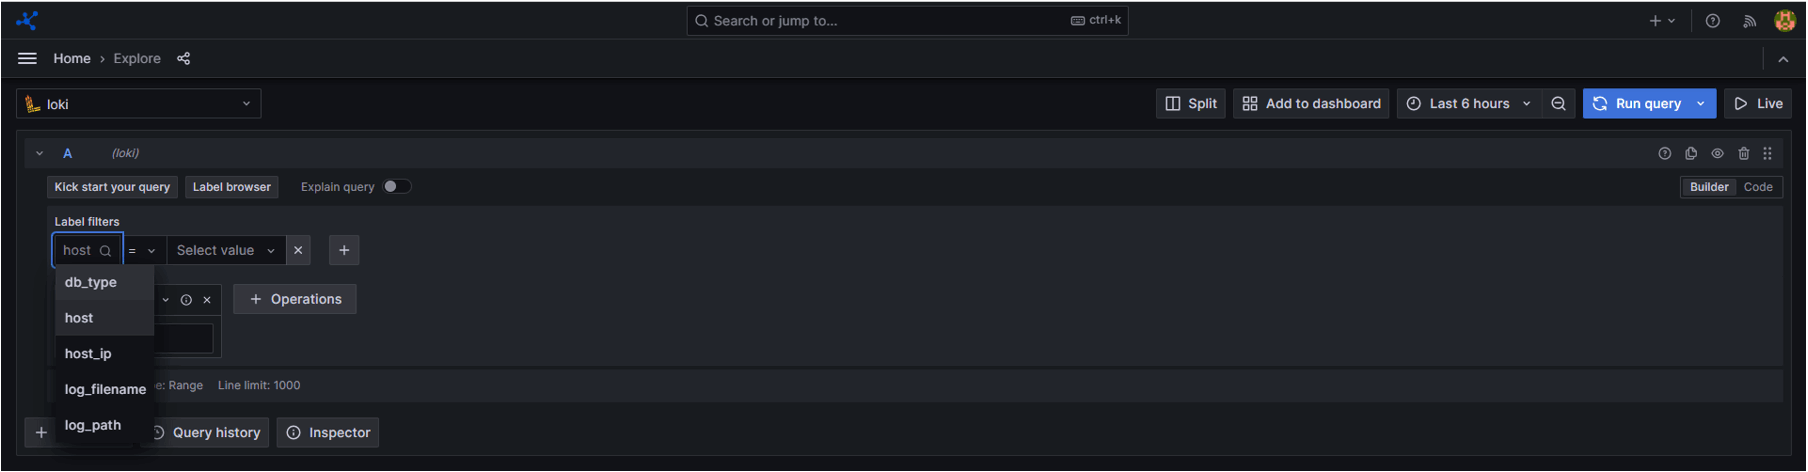
In the label filter field, select the label to view the logs.
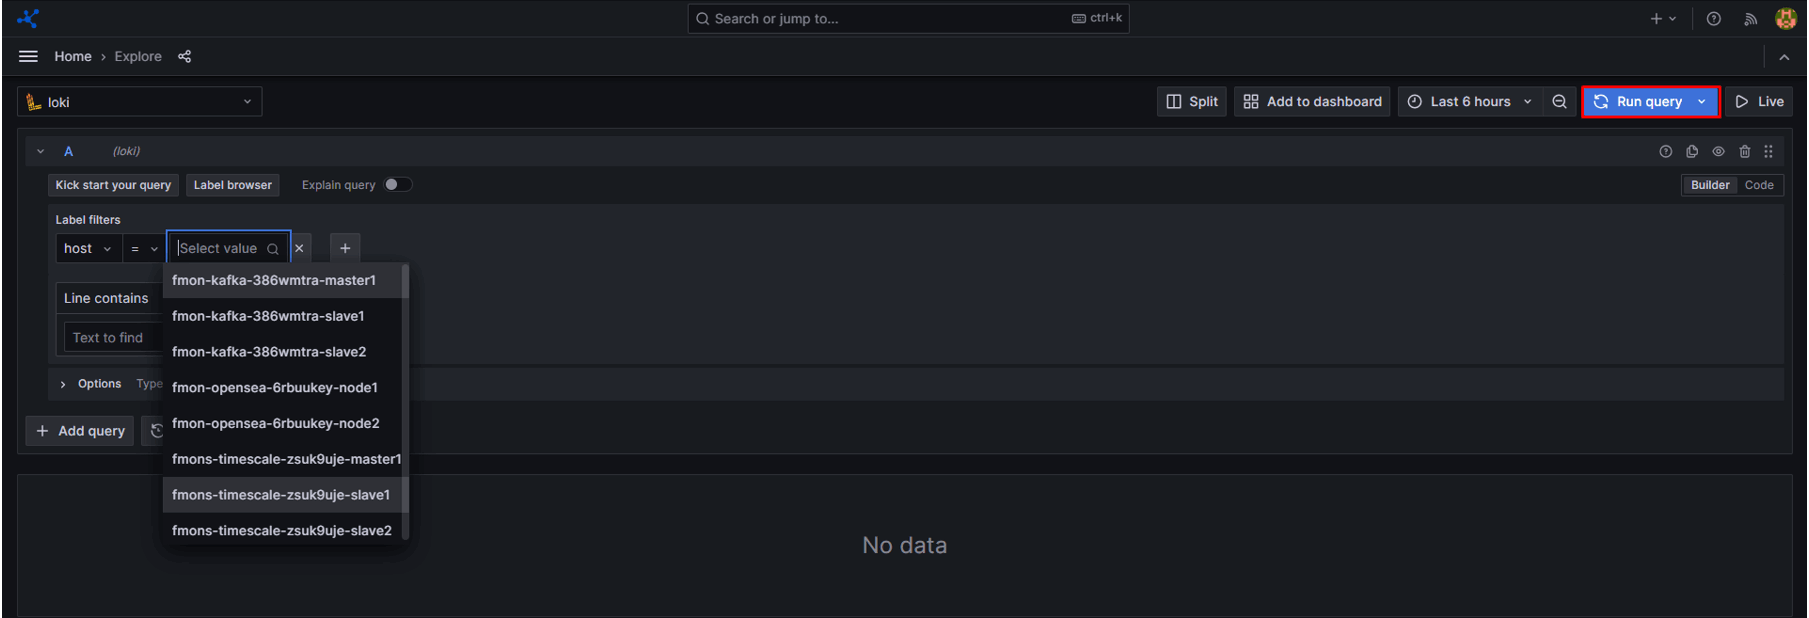
In the value filter field, select the instance to view the logs.
Logs information are displayed as below: